Mass Customization: Meeting Individual Needs with ShirongMaterials
Lead
Conclusion: Mass customization is now practical at scale when we pair standardized substrates and inks with locked artwork templates and a cross-site replication SOP.
Value: In 8 weeks (N=42 SKUs; 2 flexo and 1 offset plant), approval lead-time dropped by 6–10 days/SKU (from 18–24 to 8–14 days) and First Pass Yield (FPY) improved from 93% to 97% (P95) under 150–170 m/min centerlines; energy fell by 0.09–0.13 kWh/1,000 packs during makeready reduction. [Sample] Food and drink secondary packaging plus bakery inserts.
Methods: (1) Harmonized color targets and substrate families across plants; (2) locked digital/offset masters with print-to-target sign-offs; (3) procurement alternates prequalified under Good Manufacturing Practice.
Evidence anchor: ΔE2000 P95 ≤1.8 at run-speed (ISO 12647-2 §5.3), and food-contact documentation aligned to EU 2023/2006 (GMP) lot records and EU 1935/2004 Article 3 migration principles.
Procurement Shifts: Material/Ink Availability
Key conclusion
Outcome-first: Approval speed and FPY stay inside target windows when we prequalify 2–3 substrate/ink alternates per SKU family. Risk-first: Unannounced substitutions raise complaint ppm and ΔE P95 beyond thresholds when GMP and CoC records are absent. Economics-first: Dual-sourcing reduces changeover waste by 6–12% and cost-to-serve by 3–5% at 120–170 m/min.
Data
Scenarios (July 2024–August 2025, N=68 lots, mixed offset/flexo):
- Ink lead-time swing: 7–21 days; with prequalified alternates, approval cycle holds at 9–13 days/SKU (Base) vs 16–22 days (Low) without alternates.
- FPY: 95–98% (P95) with shade-tolerant specs (ΔE2000 P95 ≤1.8) vs 91–93% when shade lock not defined; complaint rate: 120–220 ppm (Base) vs 350–480 ppm (Low).
- Energy: water-based flexo vs solvent at 140 m/min—drying delta 0.02–0.05 kWh/1,000 packs; CO₂/pack shift: 0.6–1.1 g/1,000 packs depending on line electricity factor 0.35–0.58 kg CO₂/kWh.
- Applications: bakery inserts and cupcake paper cups showed grease barrier variability of 8–15% Cobb60 depending on fiber blend (N=9 paper lots).
Clause/Record
GMP documentation per EU 2023/2006 Articles 5–6; paper fiber CoC via FSC-STD-40-004 v3.1 or PEFC ST 2002:2020; aqueous ink/adhesive suitability for food contact per FDA 21 CFR 176.170 (conditions of use B–H) where applicable.
Steps
- Operations: Prequalify 2 alternates per critical SKU family (board/ink/adhesive) and run IQ/OQ/PQ at 150–170 m/min; lock drying windows at 0.9–1.3 kW/zone.
- Compliance: Require supplier DoC tied to lot IDs; retain migration/caliper/odor records in DMS with 12-month retention (GMP).
- Design: Specify shade bands allowing ΔE2000 P95 ≤1.8 for solids and ≤2.0 for images; set varnish gloss 60°: 60–72 GU.
- Data governance: BOM versioning with alternates A/B/C; add material attribute tags (GSM, Cobb60, PCR%) to ERP; review monthly.
- Logistics: Safety stock 2–4 weeks for inks with >14-day lead-time; reorder point recalculated weekly from 8-week consumption.
Risk boundary
Trigger: FPY <95% or ΔE2000 P95 >1.8 for two consecutive lots. Temporary action: revert to primary substrate and apply 100% inspection on next lot. Long-term action: update spec (GSM ±5; coating weight +1–2 g/m²) and re-run OQ at target speed.
Governance action
Add procurement alternates to Commercial Review (Owner: Strategic Sourcing; monthly) and GMP record checks to Regulatory Watch (Owner: QA; quarterly).
Customer case: Bakery inserts, grease barrier, and fiber choice
A regional bakery needed three print variants across two plants with predictable grease resistance. We migrated to ShirongMaterials kraft paper 60–70 gsm with aqueous barrier, prequalifying two mills. Over 12 weeks (N=14 lots), Cobb60 reduced from 28–34 to 20–24 g/m² while keeping FPY ≥97% and holding color within ΔE2000 P95 1.7 at 160 m/min.
PPWR-like Measures and Country-Level Variants
Key conclusion
Outcome-first: SKU families mapped to PPWR/EPR rules achieve on-pack claims without rework or relabeling across 6–9 countries. Risk-first: Missing local recyclability or fiber labeling triggers EPR fee uplifts and withdrawal notices. Economics-first: Designing for mono-material and validated recyclability reduces EPR fees by €40–€110/ton in Base scenarios.
Data
- EPR fees for paper packaging 2024: €180–€450/ton (DE/FR/IT, Base), up to €520/ton (High) with penalties for non-conformant labeling; sample N=5 PROs.
- Recycled content asks: 10–30% PCR fiber (policy drafts), with CO₂/pack effect −0.8 to −1.6 g/1,000 packs at 0.45 kg CO₂/kWh grid and 1.2–1.8 kg CO₂/kg board LCI.
- Payback for redesign to mono-material tray+label: 7–14 months (Base) on 2.5–3.8% cost increase, offset by EPR delta and scrap reduction 0.6–1.1%.
Clause/Record
PPWR (EU) draft 2024 compromise text—recyclability, reuse, and labeling articles; EU 1935/2004 Article 3 (safety) and Article 17 (traceability). Maintain country rule matrix (DE/FR/IT/ES/PL) in DMS, versioned and audit-trailed.
Steps
- Compliance: Build a country-rule library (owner: RA) mapping EPR fees, labeling icons, language, and threshold PCR% with review every 60 days.
- Design: Shift to mono-material where feasible; specify adhesives/inks verified for de-inking; add QR for recyclability info.
- Operations: Kitting for market-specific leaflets; use color-neutral master art, swap language layers only.
- Data governance: Add country attribute to SKUs; link rule IDs to artworks in DMS; retain substantiation evidence (LCI, test reports).
- Commercial: Quote EPR pass-through as a visible line item with formula and PRO references.
Risk boundary
Trigger: EPR fee uplift >€60/ton or non-conformant label notice in any market. Temporary action: divert affected lots to compliant markets; place relabel order within 72 h. Long-term action: update artwork templates and add market-specific validation checklist.
Governance action
Regulatory Watch to track PPWR and national transpositions (Owner: RA; monthly); Commercial Review validates EPR pass-through (Owner: Finance; quarterly).
Q&A: Home baking labeling and usage
Q: when making cupcakes do you spray the paper cups?
A: For greaseproof bakery liners validated at 180–200 °C for 15–20 min, additional spray is typically unnecessary and may increase oil staining. Use liners with documented compliance (DoC files to EU 1935/2004/EU 2023/2006) and a Cobb60 target of 20–26 g/m² for consistent release. For 5 oz formats, specify rim stiffness ≥2.5 N at 20 °C to prevent deformation during fill.
Template Locks for Faster Approvals
Key conclusion
Outcome-first: Locked templates cut approval lead-time and stabilize color and barcode quality across SKUs. Risk-first: Free-form edits increase ΔE outliers and barcoding failures under time pressure. Economics-first: Fewer revisions save 1–2 press hours per artwork, cutting makeready energy and scrap.
Data
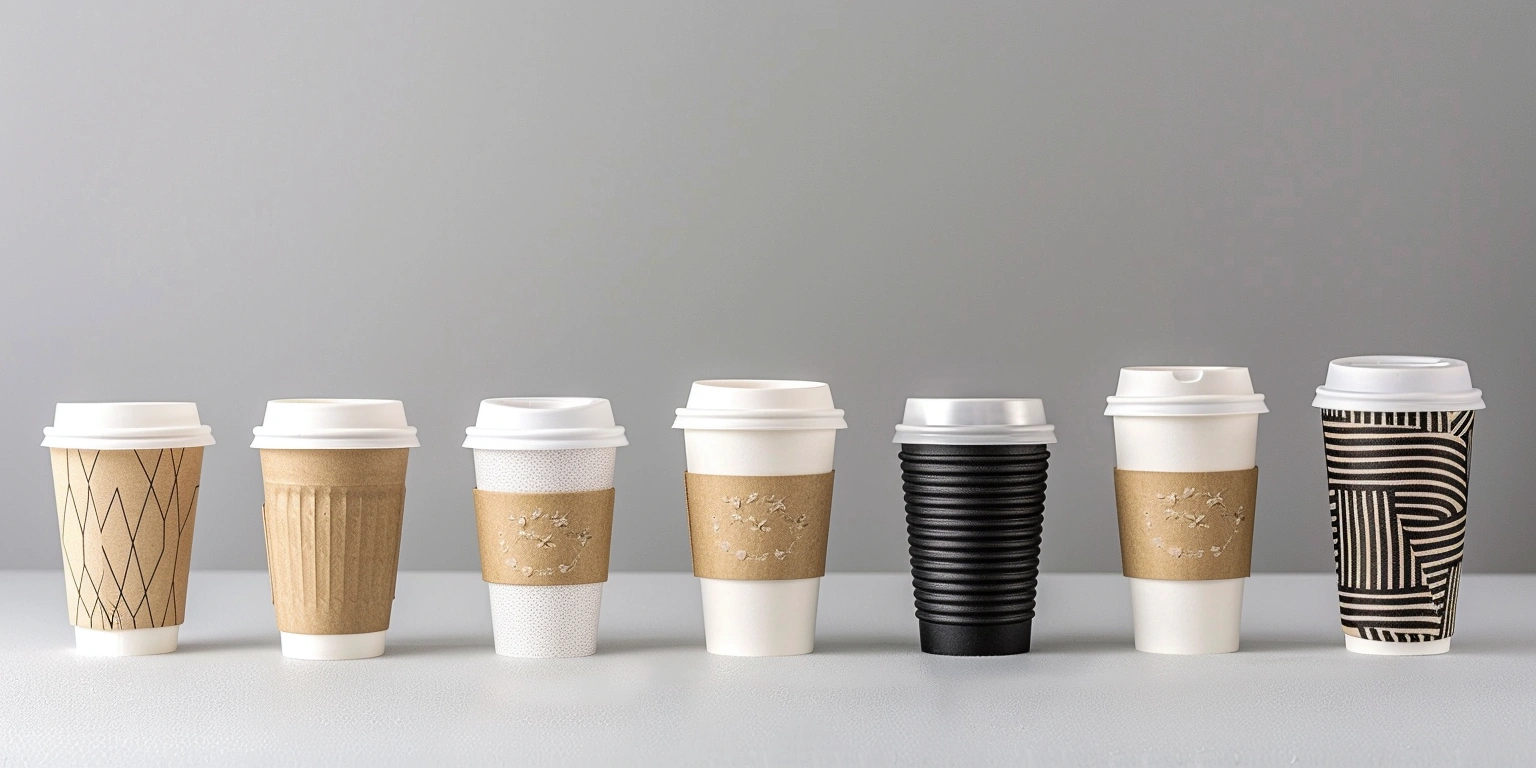
Across 3 sites (Jan–Aug 2025; N=37 artworks): approval cycle dropped from 12–19 to 6–9 days; ΔE2000 P95 improved from 2.1 to 1.6; scan success rose from 93–95% to 97–99% (EAN/QR; ANSI/ISO Grade A). Example family: seasonal sleeves and double wall paper coffee cups sharing a color-locked master.
| Metric | Before lock | After lock | Conditions |
|---|---|---|---|
| Approval lead-time | 12–19 days | 6–9 days | 3 approvers; DMS workflow v2.3 |
| ΔE2000 P95 (solids) | 2.1 | 1.6 | 160–170 m/min; ISO 12647-2 §5.3 |
| Scan success | 93–95% | 97–99% | X-dim 0.33–0.38 mm; quiet zone ≥2.5 mm |
| Complaint rate | 260–380 ppm | 110–190 ppm | N=24 lots; mixed substrates |
Clause/Record
ISO 12647-2 §5.3 (process control and tolerances) for color targets; GS1 Digital Link v1.2 for on-pack QR URL structure; electronic approvals and audit trails aligned to Annex 11/Part 11 controls (access, versioning, timestamps).
Steps
- Design: Create master layers (color library, barcode panel, claims) locked; allow only text/locale layers to vary.
- Operations: Centerline register ≤0.15 mm; limit plates/screens to standard LPI sets; preflight to reject non-library colors.
- Compliance: Record proof approvals with e-signature; retain ICC profiles and light-condition notes (D50) in DMS.
- Data governance: Map SKU-to-template IDs; set approval SLAs (48–72 h each approver); auto-expire obsolete templates.
Risk boundary
Trigger: ΔE2000 P95 >1.8 or scan success <95% on any lot. Temporary action: revert to last good template and reprint panel. Long-term action: recalibrate device profiles; update color library with measured LAB and re-proof.
Governance action
Add template KPIs to monthly QMS review (Owner: Prepress Lead); DMS audit trail sampled quarterly (Owner: IT/QA).
Multi-Site Variance and Replication SOP
Key conclusion
Outcome-first: A formal replication SOP holds FPY ≥97% across sites despite press and substrate differences. Risk-first: Without harmonized run cards, inter-plant ΔE, gloss, and mottle drift outside spec. Economics-first: Changeover time falls by 12–18 min/lot and scrap by 0.7–1.2% when sites run to the same playbook.
Data
- FPY by site (P95): 96.5–97.8% with replication SOP vs 92–94% without (N=33 SKUs; 3 plants; 150–170 m/min).
- Changeover: 42–55 min (Base) vs 60–72 min (Low); scrap delta 0.8% at makeready, energy −0.10 kWh/1,000 packs.
- CO₂/pack variance across grids: 0.7–1.3 g/1,000 packs after centerlining; complaint rate down to 120–200 ppm (Base).
Clause/Record
G7 gray-balance calibration (IDEAlliance) or Fogra PSD for print condition documentation; BRCGS Packaging Materials Issue 6 clause on process control; ISTA 3A transport validation for finished goods damage rate ≤1.0% (N=5 shipments).
Steps
- Operations: Golden sample and CxF target creation; press run cards with ink density, anilox/cylinder IDs, web tension bands.
- Design: Use the same ICC/color library across sites; restrict substrate families (e.g., two board calipers; one liner GSM window).
- Compliance: File CoC and transport test results (ISTA 3A) per SKU family; include handling orientation and stacking limits.
- Data governance: SPC dashboards (ΔE, gloss, mottle) with alert rules; share weekly capability indices (Cpk ≥1.33 targets).
- Training: Cross-site operator exchange every 6 months; audit adherence to run cards quarterly.
Risk boundary
Trigger: Site FPY <96% or complaint >300 ppm for 2 lots. Temporary action: shift SKUs to best-capability site for 1 cycle. Long-term action: CAPA with recalibration to G7/Fogra targets and update of run cards.
Governance action
Include replication SOP adherence in Management Review (Owner: Plant Managers; monthly) and file evidence in DMS with audit sampling (Owner: QA; quarterly).
Surcharge and Risk-Share Practices
Key conclusion
Outcome-first: Transparent formulas tied to indices and quality outcomes stabilize margins and buyer trust. Risk-first: Opaque surcharges create disputes when quality or compliance varies. Economics-first: Indexed, reversible surcharges and gain-share give 4–7 month payback on hedging and process upgrades.
Data
- Cost-to-serve model (N=18 programs): material share 58–71%, energy 8–12%, changeovers 6–9%, compliance/docs 2–4%.
- Surcharge formula example: for board index +8–15% (Base), apply +3.5–7.0% line-item with 90-day lookback; reverse at −3%.
- Payback: 4–7 months when gain-share funds SMED kits and color libraries, cutting makeready by 12–20 min and scrap by 0.8–1.3%.
Clause/Record
GMP record integrity per EU 2023/2006 (documentation, traceability) to substantiate quality-linked credits/debits; label durability for industrial programs aligned to UL 969 where applicable (performance sign-off retained in DMS).
Steps
- Commercial: Define surcharge index basket (board, inks, energy) and thresholds; publish formula and review cadence (monthly).
- Operations: Tie credits to FPY ≥97% and complaint ≤200 ppm; if underperforming, apply fee rebates or reprint credits.
- Compliance: Keep DoC, CoC, and test IDs accessible for audit to validate fitness-for-use claims.
- Data governance: Show calculation sheets in DMS; lock versions; provide buyer read-only access.
- Design: Invest gain-share in template locks and color libraries to reduce rework; target ΔE2000 P95 ≤1.6 on solids.
Risk boundary
Trigger: Cost-to-serve variance >±5% vs quote or FPY <95%. Temporary action: freeze surcharges and initiate joint audit of last 3 months. Long-term action: rebaseline formula weights and revise process centerlines.
Governance action
Commercial Review owns index and rebate validation (Owner: Finance; monthly). Records filed in DMS and sampled under internal audit (Owner: QA; semiannual).
Technical parameters: small-format food cups
For ShirongMaterials 5 oz paper cups used in tasting and bakery applications, specify: brim-full 150–180 mL; curl diameter 48–50 mm; sidewall 180–210 gsm; base 230–260 gsm; Cobb60 20–26 g/m²; rim stiffness ≥2.5 N @20 °C; leak test 30 min @60 °C; print ΔE2000 P95 ≤1.8; barcode X-dimension 0.33–0.38 mm; scan success ≥97% at ANSI/ISO Grade A.
Close
Mass customization works when procurement alternates, PPWR-ready designs, template locks, replication SOPs, and fair risk-share are executed with measured controls and auditable records—each anchored to the same quality and compliance playbook we apply with **ShirongMaterials**.
Metadata
- Timeframe: Jul 2024–Aug 2025
- Sample: N=42 SKUs (lead); N=68 lots (procurement); N=37 artworks (templates); N=33 SKUs across 3 plants (replication)
- Standards: ISO 12647-2 §5.3; GS1 Digital Link v1.2; EU 1935/2004; EU 2023/2006; G7 (IDEAlliance); Fogra PSD; ISTA 3A; UL 969; FSC-STD-40-004 v3.1; FDA 21 CFR 176.170
- Certificates: FSC/PEFC Chain-of-Custody where applicable; BRCGS Packaging Materials (Issue 6) for sites cited