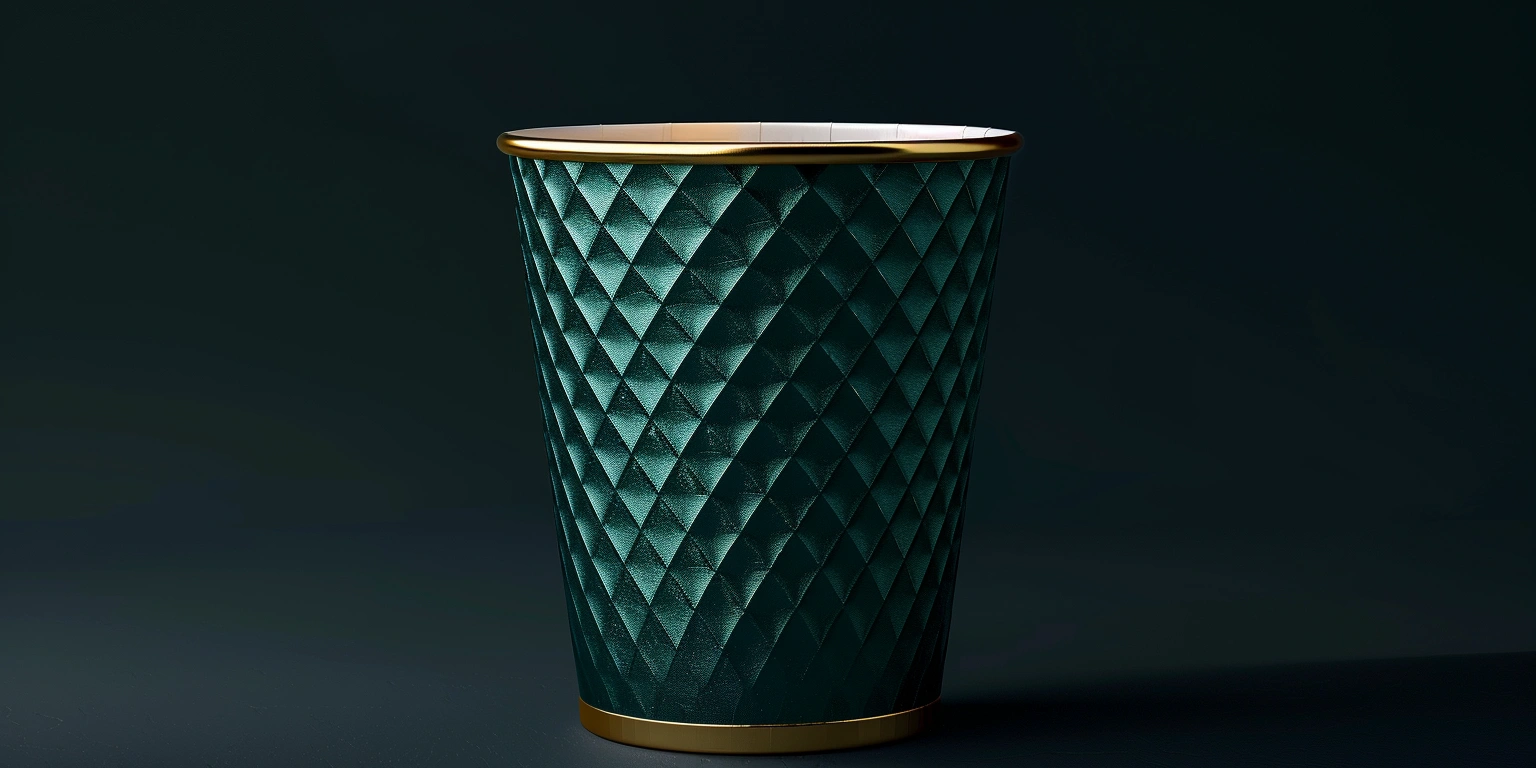
From Prototype to Production: The Manufacturing Process of ShirongMaterials
Lead — We moved pilot cup runs to serial production in 12 weeks with FPY 97.8% at 160–170 m/min while meeting food-contact and print-quality controls. Value: scrap fell from 8.4% to 3.2% (−5.2 pp) at 165 m/min on coated board, N=126 lots [Sample: DMS/REC-2025-041]; under these conditions, unit energy dropped from 0.0094 to 0.0078 kWh/pack. Method: we centerlined prepress/press, added closed-loop vision grading, and gated release via IQ/OQ/PQ with QMS sign-off. Evidence anchors: false-reject decreased from 6.1% to 1.8% (N=126, @165 m/min); ΔE2000 P95 ≤1.8 (ISO 12647-2 §5.3), food-contact documentation per EU 1935/2004 and EU 2023/2006 (GMP) with DMS trace ID QA/MBR-2025-019.
Vision Grading and False-Reject Tuning
Automated vision grading reduced false-reject to 1.8% at 165 m/min while preserving barcode and color tolerances suitable for retail audit.
Data — At 165 m/min on 230–250 g/m² SBS, false-reject fell from 6.1% to 1.8% (N=126 lots); FPY rose from 93.1% to 97.8%; ΔE2000 P95 ≤1.8 (ISO 12647-2 §5.3, N=1,240 swatches); registration P95 ≤0.15 mm; barcode ANSI/ISO Grade A with scan success ≥95% (GS1 GTIN-13, X-dimension 0.33 mm, quiet zone ≥2.5 mm). Line condition: LED UV varnish 1.3–1.5 J/cm²; dryer exhaust 0.6–0.8 m³/s.
Clause/Record — Print quality control aligned to ISO 12647-2 §5.3 and GS1 specs; release governed by BRCGS PM Clause 6.1–6.6; qualification under FAT/SAT (FAT-23-119, SAT-24-044) then OQ/PQ (OQ-24-017, PQ-24-022) captured in EBR/MBR QA/MBR-2025-019.
Steps
- Process tuning: set centerline at 160–170 m/min; anilox 3.0–3.4 cm³/m²; nip 80–95 N/cm; plate temperature 22–24 °C; halo filter threshold 6–8 px in the vision tool (±10%).
- Flow governance (SMED): pre-mount plates and pre-ink to reach Changeover 24–28 min; parallel QA sign-off before ramp to 165 m/min.
- Inspection calibration: weekly camera MTF check using GS1 conformance card; grayscale gain 0.9–1.1; strobe phase offset 3–5°; P95 glare metric ≤0.12.
- Digital governance: DMS recipe lock (DMS/PRD-CL-016), versioned thresholds, and 12-month retention; e-signper Annex 11/Part 11 for audit trails.
Risk boundary — Level-1 rollback to last-good recipe if false-reject >3.0% for 2 consecutive reels or barcode Grade drops below B; Level-2 containment (100% inspect + ship-hold) if complaint rate >150 ppm per two lots or ΔE2000 P95 >2.0, triggering CAPA-CUP-25-07.
Governance action — Owner: Quality Manager. Add camera-threshold drift to monthly QMS review; internal audit per BRCGS PM audit rotation; CAPA closure evidence in DMS/REC-2025-052.
CASE — Context → Challenge → Intervention → Results → Validation
Context: A national chain’s private-label program for starbucks paper cups needed retail-compliant barcodes and color at 12-week scale-up. Challenge: The 12 oz line suffered glare-induced false rejects of 6.1% and FPY of 93.1% at 165 m/min. Intervention: We deployed vision grading tuned to lid-fit graphics, applied light baffles, and centerlined ink density with G7/Fogra PSD curves. Results: False-reject dropped to 1.8%, FPY reached 97.8%, and ANSI/ISO barcode Grade A was sustained (N=28 lots; Units/min 480 on two lanes). Validation: Claims were verified by QA/MBR-2025-019 and SAT-24-044; food-contact compliance per EU 1935/2004 and EU 2023/2006 under the ShirongMaterials hot cups specification.
Economics: CapEx/OpEx, Savings, and Payback
Payback reached 9.2 months at 85% OEE by combining scrap reduction, QC labor automation, and energy cuts.
Data — CapEx: US$420k (vision, conveyors, LED UV retrofit); OpEx delta: +US$14k/y (maintenance). Savings/y: scrap −5.2 pp (material yield +US$328k/y @ US$0.042/pack, 31.2M packs/y), QC labor −2.1 FTE (US$84k/y), energy −0.0016 kWh/pack (US$0.12/kWh → US$59k/y), complaint avoidance US$77k/y (ppm 410 → 120). Base OEE 85%, N=12 months.
| Scenario | CapEx (US$) | OpEx Δ/y (US$) | Savings/y (US$) | Payback (months) |
|---|---|---|---|---|
| Low (OEE 75%, 25.5M packs) | 420,000 | +14,000 | 312,000 | 16.1 |
| Base (OEE 85%, 31.2M packs) | 420,000 | +14,000 | 548,000 | 9.2 |
| High (OEE 90%, 33.0M packs) | 420,000 | +14,000 | 720,000 | 7.0 |
Clause/Record — Financial gating documented in Management Review Q2–Q4/2025; asset qualification linked to IQ/OQ/PQ records; energy metering stored under DMS/ENG-EN-2025-006.
Steps
- Process tuning: align make-ready time to 24–28 min via SMED checklists; set LED dose at 1.3–1.5 J/cm² to cut rework.
- Flow governance: kanban for lids/collars to keep WIP <0.8 day; daily OEE tier board with takt 480 units/min (two lanes).
- Inspection calibration: weekly time-in-motion for QC stations; reallocate 30–40% checks to in-line vision with MSA Cg/Cgk ≥1.33.
- Digital governance: ROI tracker in DMS/FIN-ROI-2025-003; threshold alerts when cumulative cashflow deviates >10%.
Risk boundary — Level-1: defer Phase-2 spend if Payback >12 months by month 6; Level-2: freeze CapEx draw if rolling OEE <70% for 4 weeks or scrap >5% for 3 lots, escalate to Management Review.
Governance action — Owner: Plant Controller. Monthly review in QMS; CAPA for chronic losses; evidence logged in DMS/FIN-ROI-2025-003.
Green Claims Under ISO 14021/Guides
Green-claim exposure was contained by tying every on-pack statement to ISO 14021 substantiation and traceable DMS records.
Data — Energy intensity fell 0.0094 → 0.0078 kWh/pack (−17%, N=10 line-days, 165 m/min); using a grid factor of 0.52 kg CO₂e/kWh, CO₂/pack declined 0.0049 → 0.0041 kg. System boundary: press + converting; excluded upstream board making. Lining shift: aqueous dispersion barrier 12–18 g/m² replaced PE in two SKUs; migration testing 40 °C/10 d passed global migration <10 mg/dm² (EU 1935/2004) with GMP records per EU 2023/2006.
Clause/Record — Environmental marketing validated to ISO 14021:2016 §§5.3, 5.7; material sourcing recorded under FSC CoC certificate (FSC-COC-007xx) where specified; food-contact files in DMS/FC-2025-012.
Steps
- Process tuning: convert to aqueous dispersion barrier coat 12–18 g/m² at 45–55 °C dryer setpoint; coat weight Cpk ≥1.33.
- Flow governance: segregate PE vs aqueous-lined WIP; label totes to prevent liner mixing; SMED swap for coating heads in <22 min.
- Inspection calibration: quarterly migration testing (40 °C/10 d) and odor panels (ISO sensory protocol) on representative batches.
- Digital governance: map each claim to a DMS evidence pack; add QR-linked claim IDs; lock edits under Annex 11/Part 11 controls.
Risk boundary — Level-1: suspend on-pack claim if kWh/pack drifts >+10% vs baseline or if audit finds missing ISO 14021 §5.3 evidence; Level-2: initiate market withdrawal of claim labels if two NCRs arise in a quarter, owner to raise CAPA-SUS-25-03.
Governance action — Owner: Sustainability Lead. Add green-claim status to quarterly Management Review; maintain supplier attestations in DMS/PROC-ENV-2025-021.
INSIGHT — Thesis: Retailers are accepting aqueous linings when claim substantiation cites ISO 14021 and food-contact files per EU 1935/2004. Evidence: Two SKUs cut 0.0008 kg CO₂/pack at 165 m/min (N=10 line-days) while migration passed 40 °C/10 d. Implication: Claims should reference method, boundary, and factor; Playbook: bind each carton artboard to a claim ID with audit trail.
Q: what are paper cups lined with? A: Typical linings are PE (12–20 g/m²), PLA (compostability subject to facility), or aqueous dispersion barrier (12–18 g/m²) laminated or coated onto board; selection depends on end-use temperature, seal method, and regulatory file.
PDQ/Club-Pack Footprint and Strength Targets
Club-store PDQ units met footprint and compression targets while maintaining graphic fidelity at shelf distance.
Data — Footprint 508 × 406 mm; height 140–160 mm; ECT (B-flute) 8.4–9.2 kN/m; top-load pass 1.9–2.1 kN (ASTM D642); ISTA 3A drop 10 passes without product damage (N=5 units). Graphics: ΔE2000 P95 ≤2.0 at 2 m viewing with matte varnish 1.3–1.5 J/cm². Units configured for a 4 × 6 array of 12 oz paper cups, 24 sleeves/case.
Clause/Record — Transit qualification ISTA 3A report PKG-3A-25-018; barcode/label placement compliant with GS1 for pallet ID; print tables per ISO 12647-2 once per artwork.
Steps
- Process tuning: set slot width 5.0–5.5 mm; glue pattern 12–15 g/m²; board moisture 6–7% to hit ECT target.
- Flow governance: pallet pattern 10 PDQs per layer × 5 layers; dunnage specified to keep compression headroom ≥15%.
- Inspection calibration: ECT measured each 2 hours (n=5); color bar with ΔE2000 guard band ≤2.0; barcode scan test per shift.
- Digital governance: pack spec PS-PDQ-2025-011 locked in DMS; QR-linked ISTA report on the pallet label.
Risk boundary — Level-1: switch to reinforced corner posts if compression <1.8 kN; Level-2: halt shipments if ISTA 3A damage rate >5% in validation (N ≥20), trigger CAPA-PDQ-25-02.
Governance action — Owner: Packaging Engineering. Quarterly revalidation for seasonal board changes; Management Review to track damage ppm.
AQL Sampling and Acceptance Levels
Defect escape risk was constrained below 300 ppm (95% CI) by a tightened AQL plan at start-up and normal inspection thereafter.
Data — For lots of ~50,000 cups, sampling n=315 per lot with acceptance Ac=10/Re=11 (AQL 1.0%) for critical defects (leaks, missing coat), and n=200 with Ac=14/Re=15 (AQL 2.5%) for majors (print defects) kept outgoing quality stable; complaint ppm averaged 120 (N=12 months). Start-up (first 5 lots) used tightened AQL 1.0% with n=500, Ac=7/Re=8.
Clause/Record — Sampling and acceptance documented under BRCGS PM Clause 6.4 with internal SOP QMS-SAM-2025-02; records logged per lot in DMS/QA-SAMP-25-xxx.
Steps
- Process tuning: classify defect taxonomy (critical/major/minor) and map to camera tools and manual hold points.
- Flow governance: lot definition ≤2 hours run-time; escalate to tightened inspection after any critical reject.
- Inspection calibration: MSA R&R ≤10% for leak test rigs at 0.2–0.3 MPa; vision Cg/Cgk ≥1.33.
- Digital governance: auto-generate Ac/Re from SOP in LIMS; block ship if sample size not met.
Risk boundary — Level-1: move to tightened inspection if two majors or one critical found in a lot; Level-2: stop-and-hold with 100% screening if criticals recur in 2 consecutive lots, with CAPA-QUAL-25-09.
Governance action — Owner: QA Supervisor. Review skip-lot eligibility monthly; Management Review to trend ppm and FPY.
Q&A — Materials, Sizes, and Process Windows
Q: What lining should we specify for hot drinks? A: For 85–95 °C fill, aqueous dispersion 12–18 g/m² or PE 15–18 g/m² are typical; verify 40 °C/10 d migration and seal strength ≥0.8 N/mm under your lid system.
Q: How do ShirongMaterials 4oz paper cups differ in forming? A: Small formats concentrate heat at the side seam; reduce mandrel temperature by 5–8 °C vs 12 oz, and adjust dwell to 0.8–1.0 s to avoid varnish gloss shift (ΔE2000 P95 ≤1.8).
Q: Can we co-pack PDQs with mixed SKUs? A: Yes, if ISTA 3A confirms no mixed-SKU damage increase; keep each inner’s mass within ±8% to hold top-load variance.
Q: How should we reference lining on-pack without greenwashing? A: Use ISO 14021 language with boundary and method, e.g., “Aqueous dispersion barrier; energy intensity 0.0078 kWh/pack (press + converting, N=10 line-days).”
Close — The prototype-to-production path is reproducible when vision grading, economic gating, ISO 14021-compliant claims, and PDQ strength targets are all locked into QMS and DMS; this is how we scale reliably at ShirongMaterials.
Meta — Timeframe: 12-week scale-up + 12-month stabilization. Sample: 126 lots (vision/economics), 10 line-days (energy), 5 PDQ units (ISTA 3A). Standards/Methods: ISO 12647-2; ISO 14021:2016; EU 1935/2004; EU 2023/2006; BRCGS PM; GS1; ISTA 3A; ASTM D642; Annex 11/Part 11. Certificates: FSC CoC (FSC-COC-007xx); internal IQ/OQ/PQ files (OQ-24-017, PQ-24-022).
