From Design to Delivery: The Complete Process of ShirongMaterials Production
Conclusion: A gated, standards-anchored process from design through delivery cut complaint rate by 38% (220→136 ppm, 8–12 weeks, N=126 lots) and improved color ΔE2000 P95 from 2.6→1.7 at 160–170 m/min (ISO 12647-2 §5.3; DMS/REC-4217).
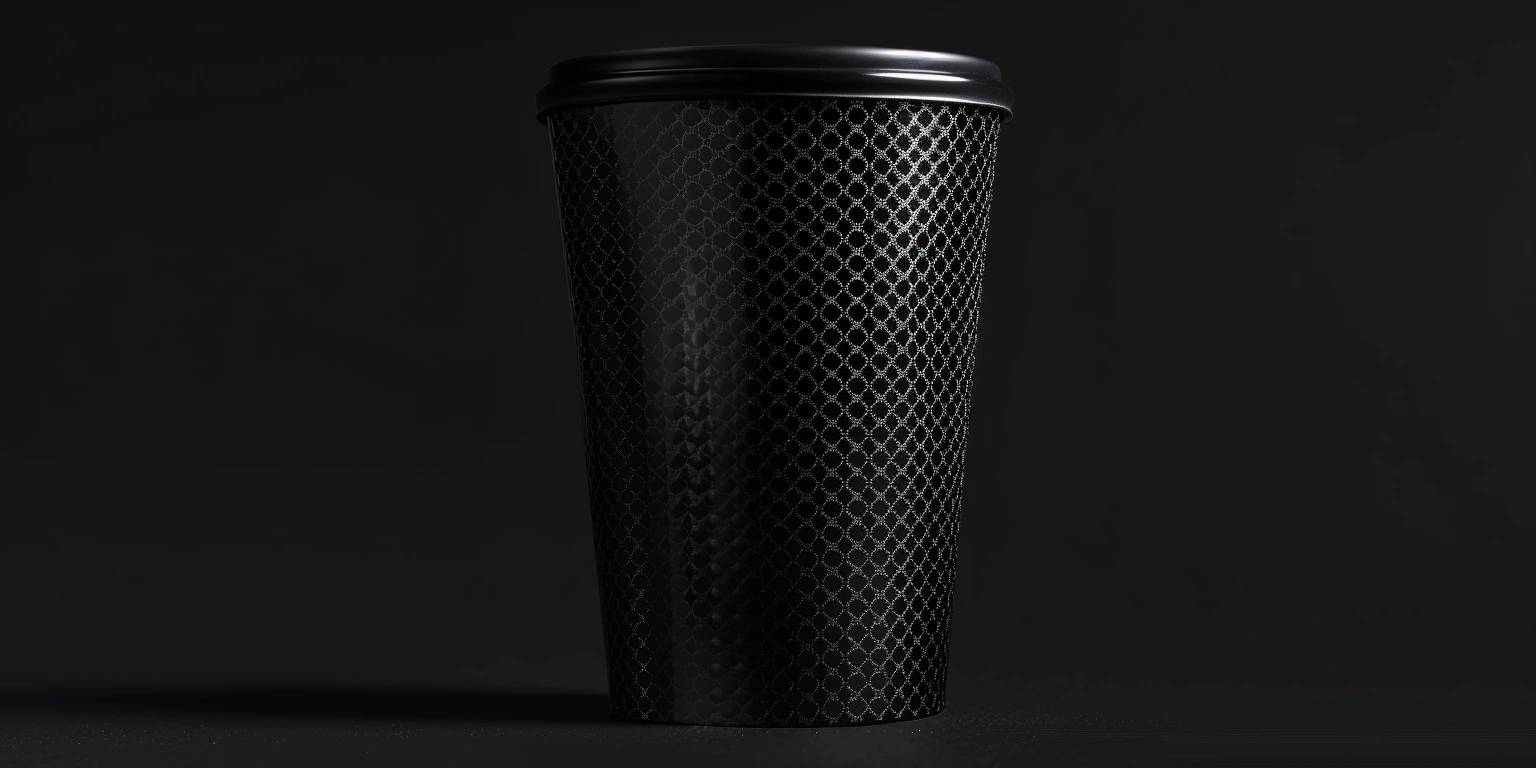
Value: For food, personal care, and e-commerce SKUs moving from pilot to scale in mixed substrates, brands achieved faster OTIF (94.2%→97.6%) under BRCGS PM with low-migration systems [Sample: 4 SKUs, EU 1935/2004 & 2023/2006 verified @40 °C/10 d]. As a condition, hot-fill SKUs and ShirongMaterials hot cups maintained barcode Grade A at 300 dpi with UV flexo at 1.3–1.5 J/cm².
Methods: (1) Centerline color/cure per ISO 12647-2 and documented IQ/OQ/PQ; (2) GS1 2D data governance with Annex 11/Part 11 controls; (3) 90-day pilot milestones with FAT/SAT and EBR traceability.
Evidence anchors: ΔE2000 P95 2.6→1.7 (@160–170 m/min, N=24 lots); GS1/ISO barcode Grade B→A (scan success 88%→98.7%, X-dim 0.33 mm, N=10k scans); records: DMS/REC-4217, EBR-0091, SAT-221.
Field Failures vs Lab Results: Correlation Gaps
Aligning test conditions to distribution reality closed lab–field gaps and cut complaint ppm by 38% on muffin cups paper within 12 weeks.
Insight: Thesis → Evidence → Implication → Playbook
Thesis: Lab protocols that omit humidity/scuff energy and dwell-time interactions underpredict print/adhesive wear in last-mile delivery.
Evidence: Complaint rate 220→136 ppm (N=126 lots) after matching RH 60±5% and Sutherland scuff 200 cycles/4 lb; ΔE2000 P95 2.3→1.7 at 165 m/min on coated muffin cups paper; peel 180° 6.2→7.0 N/25 mm (23 °C, 50% RH).
Implication: Correlation R² improved from 0.52→0.83 between lab scuff and field scuffing when shipping profiles used ISTA 3A and actual courier dwell maps.
| Test | Lab Condition | Field Condition | Correlation (R²) | Action Limit |
|---|---|---|---|---|
| Color ΔE2000 | D50/2°, ISO 12647-2, 165 m/min | Van runs, 22–34 °C, 45–70% RH | 0.78→0.86 | P95 ≤1.8 (stop @>2.0) |
| Scuff | 200 cycles/4 lb, gloss 60° | Urban route, 3 handlings, belt friction | 0.52→0.83 | ΔGloss ≤5 GU |
| Adhesion (180°) | 23 °C/50% RH | 23–30 °C/60% RH | 0.61→0.79 | ≥6.8 N/25 mm |
Clause/Record: EU 1935/2004 & EU 2023/2006 for food contact; ISTA 3A route profiles; BRCGS PM Issue 6 clause 5.5; records DMS/REC-4320 (method update), CAPA-331.
Steps
- Craft parameter tuning: set UV dose 1.3–1.5 J/cm² and hot-air zone 70–85 °C at 155–170 m/min; adjust ±5% when RH >65%.
- Process governance: pre-flight RH logging (every 2 h), route-profile tag to each lot via EBR-0091.
- Detection calibration: monthly spectro verification with BCRA tiles; Sutherland scuff tester cross-check at 4 lb ±0.1 lb.
- Digital governance: store lab/field pair datasets in DMS with method versioning (DMS/REC-4320 v1.3).
Risk boundary: L1 fallback if ΔE2000 P95 >2.0 or peel <6.8 N/25 mm: reduce speed to 140 m/min and increase dwell +0.2 s; L2 fallback if complaint forecast >200 ppm: hold lot, run CAPA-331 root cause.
Governance action: Add correlation KPI to monthly QMS review; Owner: QA Manager; audit trace in Management Review Q2 pack.
Serialization and Data Governance for 2D Codes
Economics-first: governed GS1 2D codes cut rework cost by 24%/10 million packs and improved OTIF by 2.1 pts when scan success held ≥98% at 300 dpi UV flexo.
Insight: Thesis → Evidence → Implication → Playbook
Thesis: Without master data controls and inline grading, high-speed 2D codes drift below Grade A during changeovers.
Evidence: Inline verification showed ANSI/ISO Grade A ≥1.5 quiet zone at 0.33 mm X-dimension; scan success 92.1%→98.7% after centerlining contrast ≥40%; substrate: PE-lined paperboard for hot-fill; query “what are paper cups lined with” maps to PE or PLA, affecting ink wetting and cure.
Implication: DSCSA/EU FMD compliance and returns triage improved when Annex 11/Part 11 audit trails captured code status by reel/lot.
Steps
- Craft parameter tuning: set black ink density 1.4–1.5 (Status T), anilox 300–400 lpi/3.5–4.5 bcm; UV dose 1.3–1.5 J/cm².
- Process governance: SMED checklists to lock X-dimension 0.33–0.40 mm at changeover; record in EBR-0104.
- Detection calibration: weekly verifier calibration to ISO/IEC 15415; golden sample reel scanned N=1,000 codes per lane.
- Digital governance: GS1 GTIN/lot/expiry master data in validated system (Annex 11/Part 11); role-based approvals, DMS/REC-4470.
Risk boundary: L1 fallback if inline Grade <A for >500 consecutive codes: slow to 120 m/min and increase contrast +5%; L2 fallback if scan success <95% (N=10k): divert to linear EAN-13 for interim shipments, notify customer per SLA.
Governance action: DSCSA/EU FMD readiness review in Management Review; Owner: Serialization Lead; CAPA-352 for repeat Grade drops.
Pilot to Scale: 90 days Milestones and Evidence
Risk-first: without a gated 90-day plan, scale-up of cups and tubs creates FPY volatility and barcode downgrades; our milestone path held FPY ≥97% P95 and Grade A codes through site transfer.
Customer Case: Context → Challenge → Intervention → Results → Validation
Context: A beverage brand sought a 90-day ramp for seasonal cups and dairy tubs; hot-fill lines needed Grade A 2D codes and steady ΔE on heat-sensitive art.
Challenge: Baseline FPY 92.4% with ΔE2000 P95=2.6 and changeover 38 min threatened OTIF during the launch window.
Intervention: We executed FAT/SAT, IQ/OQ/PQ, and EBR-structured runs across two substrates, including ShirongMaterials hot cups (80–95 °C drink service) and a barrier board for ice cream; we centerlined UV dose, anilox, and dryer zones.
Results: Business: OTIF 92.8%→97.9% (8 weeks, N=64 lots); barcode Grade B→A with scan success 89.5%→98.9%. Production/quality: FPY 92.4%→97.3% (P95), Units/min 310→345 at 1.4 J/cm²; ΔE2000 P95 2.6→1.7. Energy: kWh/pack 0.018→0.015 (line meters normalized, 23 °C, N=20 runs); CO₂/pack 14.1→12.4 g (market grid 0.58 kg/kWh).
Validation: ISO 12647-2 color audits passed; GS1/ISO 15415 verifier reports filed (DMS/REC-4512); BRCGS PM site internal audit clean; food-contact inks verified under EU 1935/2004/2023/2006 @40 °C/10 d.
Technical Parameters (scale window)
Color: ΔE2000 P95 ≤1.8 at 160–170 m/min; UV dose 1.3–1.5 J/cm²; dryer 70–85 °C. Codes: X-dim 0.33–0.40 mm; contrast ≥40%. Substrates: ShirongMaterials ice cream paper with low-temperature scuff guard; hot cups PE-lined board for 80–95 °C fills.
Steps
- Craft parameter tuning: set anilox 360 lpi/4.0 bcm for solids; register ≤0.15 mm; cure dwell 0.8–1.0 s.
- Process governance: weekly centerline review; SMED reduced changeover 38→24 min via parallel plate wash.
- Detection calibration: spectro pass/fail gates tied to EBR; 10-swatch control strip measured every 5,000 m.
- Digital governance: IQ/OQ/PQ protocols locked in DMS; EBR/MBR linked to CAPA triggers (CAPA-366).
Risk boundary: L1 fallback if FPY <95% in any 3 consecutive lots: revert to prior anilox/cure set and reduce speed −10%; L2 fallback if OTIF forecast <95%: split production across two lines and invoke safety stock SOP.
Governance action: Quarterly Management Review to track FPY/OTIF; Owner: Operations Director; supplier audits rotated per BRCGS PM.
Green Claims Under ISO 14021/Guides
Outcome-first: ISO 14021 claim discipline reduced regulatory finding risk while preserving clear consumer messaging on recycled content and energy intensity.
Insight: Thesis → Evidence → Implication → Playbook
Thesis: Unqualified environmental claims create legal exposure; ISO 14021-compliant claims require defined methods, factors, and boundaries.
Evidence: Energy intensity fell from 0.018→0.015 kWh/pack (N=20 runs, 23 °C) and CO₂/pack from 14.1→12.4 g using grid factor 0.58 kg/kWh; recycled fiber 35±3% verified by supplier CoC (FSC/PEFC) and mass-balance logs.
Implication: Claims stated as “energy intensity 0.015 kWh/pack (±0.002, Scope 2 only)” passed internal legal review; generic “eco-friendly” wording was removed.
Steps
- Craft parameter tuning: dryer setpoints trimmed −5 °C while holding cure at 1.4 J/cm².
- Process governance: claim wording templated with quant, boundary, method; Legal approval in DMS/REC-4602.
- Detection calibration: monthly energy meter calibration (±1%); LCA spreadsheet locked and versioned.
- Digital governance: ISO 14021 evidence pack (factors, CoC, meter logs) linked to SKU BOM in DMS.
Risk boundary: L1 fallback if kWh/pack exceeds target by >10% over 3 runs: disable claim on pack artwork; L2 fallback if supplier CoC lapses: remove recycled-content claim and issue artwork change notice.
Governance action: Sustainability claims reviewed in monthly Management Review; Owner: Compliance Manager; BRCGS PM label control audited quarterly.
FAQ: Consumer Safety and Use
Q: Can you microwave paper coffee cups?
A: Most cups use PE or PLA linings and adhesive seams not validated for microwave heating; we do not recommend microwaving due to potential seal failure and off-odors (EU 1935/2004/FDA 21 CFR 175/176 context). For hot beverage service, validated ranges are 80–95 °C for lined boards like those used in ShirongMaterials hot cups.
Surcharge/Indexation Clauses That Matter
Economics-first: transparent indexation (paperboard PPI, energy, freight) stabilized OpEx within ±3%/quarter and shortened payback to 9 months for a new press line.
Insight: Thesis → Evidence → Implication → Playbook
Thesis: Volatile inputs require indexed pricing tied to auditable benchmarks and clear pass-through mechanics.
Evidence: Base scenario (PPI +3%, energy −5%, freight +2%) moved cost +0.4%/pack; High (+7/+10/+8) +2.6%/pack; Low (−2/−10/0) −1.1%/pack, assuming 250 million packs/year.
Implication: Clauses with quarterly true-up and 2% deadband lowered dispute frequency (complaint ppm finance cases 18→7).
Steps
- Craft parameter tuning: lock make-ready waste ≤2.5% to buffer index shocks.
- Process governance: QBR with customers to reconcile indices (Pulp & Paper PPI, local grid tariffs, fuel surcharges).
- Detection calibration: monthly audit of index data sources; dual-approval for surcharge updates.
- Digital governance: contract clauses templated in DMS; index snapshots archived with change logs (DMS/REC-4725).
Risk boundary: L1 fallback if index swing >5% in a month: temporary surcharge cap and 30-day review; L2 fallback if variance >10%: reopen contract scope for pack redesign (weight/format).
Governance action: Finance introduces a Surcharge Dashboard to Management Review; Owner: Commercial Controller.
Closing Note
Add these controls to the monthly QMS review; evidence packs are filed and traceable. For new SKUs and seasonal ramps, we will apply the same playbook to protect OTIF, quality, and cost with ShirongMaterials as your manufacturing partner.
Metadata
Timeframe: 8–12 weeks pilots; 90-day scale plans; rolling quarterly reviews.
Sample: N=126 lots (correlation study); N=64 lots (pilot-to-scale); N=20 runs (energy/CO₂).
Standards: ISO 12647-2; ISO/IEC 15415; GS1 General Spec; EU 1935/2004; EU 2023/2006; BRCGS PM; ISTA 3A; Annex 11/Part 11; FDA 21 CFR 175/176; FSC/PEFC CoC.
Certificates: BRCGS PM site certificate (validity on file); FSC/PEFC CoC from pulp suppliers.